Managing a supply chain involves tackling practical issues, such as managing supplier relationships, in delivering products to customers. It requires navigating a complex network of carriers, providers, and lanes to find the best solutions that meet customer needs. But even with the most integrated supply chain operation, there are questions around which levers you can pull to get the best results, such as:
- What happens if we change fulfilment from location A to location B? How will it impact our business and costs?
- If a change leads to negative consequences, what’s our fastest way to resolve it?
- Can another provider better deliver on time and maintain service level agreements?
Answering these questions is crucial for your supply chain and overall business, influencing factors like service quality, cost efficiency, and customer satisfaction. The consequences for your operations, like increased transportation costs and missed SLAs, could damage your reputation to customers and suppliers alike. Understandably, supply chain leaders like yourself might feel some nervousness around making such big changes without the ability to test first.
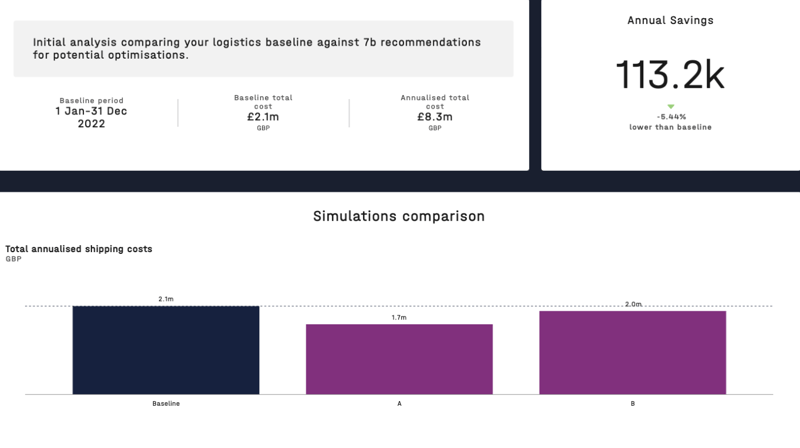
The 7bridges Simulation layer is here to help, providing customised dashboards that replicate multiple scenarios and offers confidence without unexpected risks.
Enter the Simulation layer
The 7bridges Simulation layer is a game-changer that addresses a range of challenges by offering a test environment for simulating different scenarios. Whether you're sourcing goods globally, optimising outbound shipping, or considering direct-to-consumer strategies, our Simulation layer covers all bases.
Our simulation layer begins by baselining your actual data and can benchmark against global benchmark data
Unlike logistics providers or consultants with limited access to their own data, our platform combines your actual data (rate cards, contracts, invoices) with global benchmark data from all of our platform partners.
Here's how it works:
- You provide your rate cards, contracts, and invoices, which serve as the foundation for a total view of your current operations
- We analyse a sample of your shipments, examining the locations and providers you used, and get a baseline for your current spend and provider performance
- The Simulation layer would take in the necessary information, like new rate cards or providers, from your data and display the outputs in chart form, outlining the best providers, lanes, costs, etc. for your constraints, based on your requirements
- The Simulation layer offers the outputs in tabulated form or in charts, providing insights such as optimal providers for your given data or the most efficient options to fulfil orders, via multiple simulation dashboards
Multiple outputs in one place
The beauty of our Simulation layer is that it brings together several different outcomes for your questions in one convenient place. Instead of checking multiple dashboards, reports and files, you can compare various scenarios simultaneously right inside the platform.
With this tool, you can make decisions with confidence and minimise unnecessary risks. Plus, it saves you from the frustration of dealing with human errors that often occur when sifting through rate cards, evaluating providers, and doing complex analyses. Our customers love how this tool boosts their operations and simplifies their processes.
A recent customer example will help illustrate this quite well:
Company X, which historically relied on DHL and FedEx, discovered through our Baseline and Benchmarking layer that they were spending around £1000/month using DHL alone. However, by using DPD, the cost would be around £750. We recommended a procurement simulation exercise to explore better options.
In this exercise, Company X provided us with a year's worth of data, and then went to market to find new rate card possibilities to test. They requested several providers to bid for business using that data as a sample. Each provider offered their best rate cards for consideration. Instead of manually sifting through numerous rate cards, prone to human error, our simulation layer took charge.
Even with the most sophisticated operations, manually sifting through any number of rate cards to gauge the best provider is complex. Company X used the Simulation layer to do those calculations, saving them time and energy.

You can simulate the costs for numerous providers based on your data to find the optimal choice
Company X used the Simulation layer to help them select the data set they want the providers to bid against, ingest that dataset into the platform with all the acquired rate cards, and “press play”.
The platform then selected each item in that data set, found the rate card best suited for each shipment, line by line, and finally gave them the most optimal way to fulfil their shipments with the rate cards received.
What’s even more exciting is the further level of analyses the platform was able to provide by breaking down those results.
Depending on the factors most important to you, you are able to ask questions about your network and see which provider will cost the least to use, or…
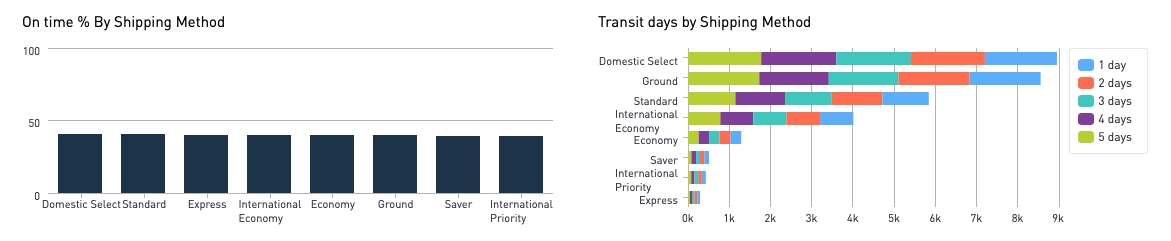
..what the most efficient option is to fulfil your orders.
It’s as easy as just giving us your rate cards and invoices, and discovering a whole world of insights in the simulation layer.
How the Simulation layer delivers results
The Simulation layer is helping our customers with various supply chain issues, particularly with the use of customised dashboards for multiple scenarios, enabling them to:
- Optimise complex networks: Test scenarios and analyse the impact of changes like provider switches, term renegotiations, warehouse relocations, or new carrier additions.
- Assess change impact: Simulate orders with new rate cards and measure cost and performance outcomes in real-time, allowing for informed decision-making.
- Identify cost and performance insights: Gain valuable information about shipping costs with different network configurations, understanding the trade-offs between cost and performance.
- Select optimal solutions: Run multiple negotiations to fine-tune provider selection, comparing cost and performance metrics to identify the best options for your supply chain.
- Embrace data-driven decisions: Leverage visualisations and analytics to gain a comprehensive view of your supply chain network's performance, costs, and other relevant factors.
Our Simulation layer offers the convenience of multiple outputs in one place, eliminating the need for checking various dashboards and files. With this tool, you can confidently make decisions while minimising risks and avoiding human errors. Leverage the power of simulation to find the most cost-effective provider, the most efficient option to fulfil your orders or test whatever factor you want to optimise next. And do it all within one easy-to-use platform.
To learn how to take advantage of our multi-output simulation layer and reach your business goals, book a demo here.