Putting an end to ‘Garbage-In-Garbage-Out’ for your supply chain data

Your data is the most valuable part of your supply chain. And getting it wrong can cost much more than you expect.

A major concern that we hear again and again is this pervasive idea of “Garbage-In-Garbage-Out” (GIGO).

What do we mean by GIGO (Garbage-In-Garbage-Out) when it comes to supply chain data management?

GIGO is a concept that is pretty common in the world of data. In essence, it means that when you put poor data into a system, you get useless results out. Even if you haven’t heard the phrase, you’ve most likely experienced the phenomenon.

Issues include data that is:

Too much and overwhelming
Delayed or comes in infrequently
Inconsistently formatted
Inaccurate or missing

Most supply chain data problems fall into one of those categories and can have far-reaching impacts on your network’s ability to move goods effectively. For many industries, this largely means financial impacts. But, as you know, with pharmaceutical supply chains lives can be at stake, so ensuring your data is high quality is that much more important.

Learn more: Everything you need to know about baseline supply chain data visibility

GIGO - Garbage in Garbage out - shaded

Why supply chain data concerns get chalked up to Garbage-In-Garbage-Out

Often we find that any concerns around data validity and usefulness get swept into this idea of GIGO. After all, if your data input is bad, you can’t expect a better output. But is your starting data really that bad? Or is it a matter of not knowing what you don’t know?

 

Team Green Icon

No in-house data team

One reason that you might feel like you have difficulty with your data input is that you don’t have any data specialists in your team. While you or someone on your team might be quite data savvy, it doesn’t quite compare to having someone on hand who lives and breathes data. 

This means that your supply chain is missing out on the effective ways that data experts would approach problems. In other words, your business is missing out on the ability to understand useful data that you already have.

This in turn, could lead to you missing useful data that you already have, but can’t use the way it is now. 


Control Green Icon

No control over provider data

Another reason you may feel like all of your data input is garbage is that it’s coming from third parties and providers. This means you don’t have any control over the data that comes into your network. When this happens, you can frequently be given data that doesn’t suit your needs or is in a unhelpful format.

For example, different providers often have different words for similar services. Or they have services that are called the same thing but have slightly different deliverables. They might also use different formats or file types, making it that much harder to compare each of them. Especially if you have to gather that data yourself.

Explore data Green Icon

Hard to know what data you need

Supply chain leaders like you are frequently called on to fight fires and react to changes quickly. While this can be extremely helpful in your role, it does sometimes mean you don’t have time to sit back and consider things like what you need out of your data. And, often, even if you know what you want to get out of it, you don’t have clarity on what data points you would need in order to achieve those goals.

All of these issues can lead you to feel like all you have is useless, data-heavy garbage instead of the goldmine of opportunities you really do have. 

Benefits of good supply chain data

Here are the top ways that better, cleaner data will benefit supply chain leaders like you:

graph magnifier Icon green

Visibility

By having good, useful supply chain data, you’ll get much clearer, more accurate visibility into how your supply chain is performing. This is especially helpful in the pharma sphere where getting deliveries to the right person at the right time (and at the right temperature) can be lifesaving.
mint bar graph icon

Baselining

Using supply chain data that has been standardised, you’ll be able to create a detailed baseline view of your data. With this you’ll have the ability to look into your supply chain and see how your operations are actually performing, where there is room for improvement and how any changes you implement will impact things.
Alert Green Icon

Reduce risk

Good supply chain data can also make a lot of things possible to make your supply chain more resilient and to help you avoid disruption. With good data, you can use tools like simulations to accurately predict how changes might impact your supply chain and plan ahead for potential scenarios.
Hand Icon Green

Negotiation power

Having better data visibility, you’ll have a clear understanding of how your supply chain is performing… and how it isn’t. That, paired with global benchmarks like what you get access to with 7bridges, can help you negotiate fairer and better tailored rate cards for the performance you’re receiving.

So what exactly does this look like?

One organisation we work with, a global CDMO (contract development and manufacturing organisation) in the pharma industry, found that they already had access to much of the data they needed, but weren’t able to use it in a way that provided insights. Instead, much of what they wanted to see was hidden from them.

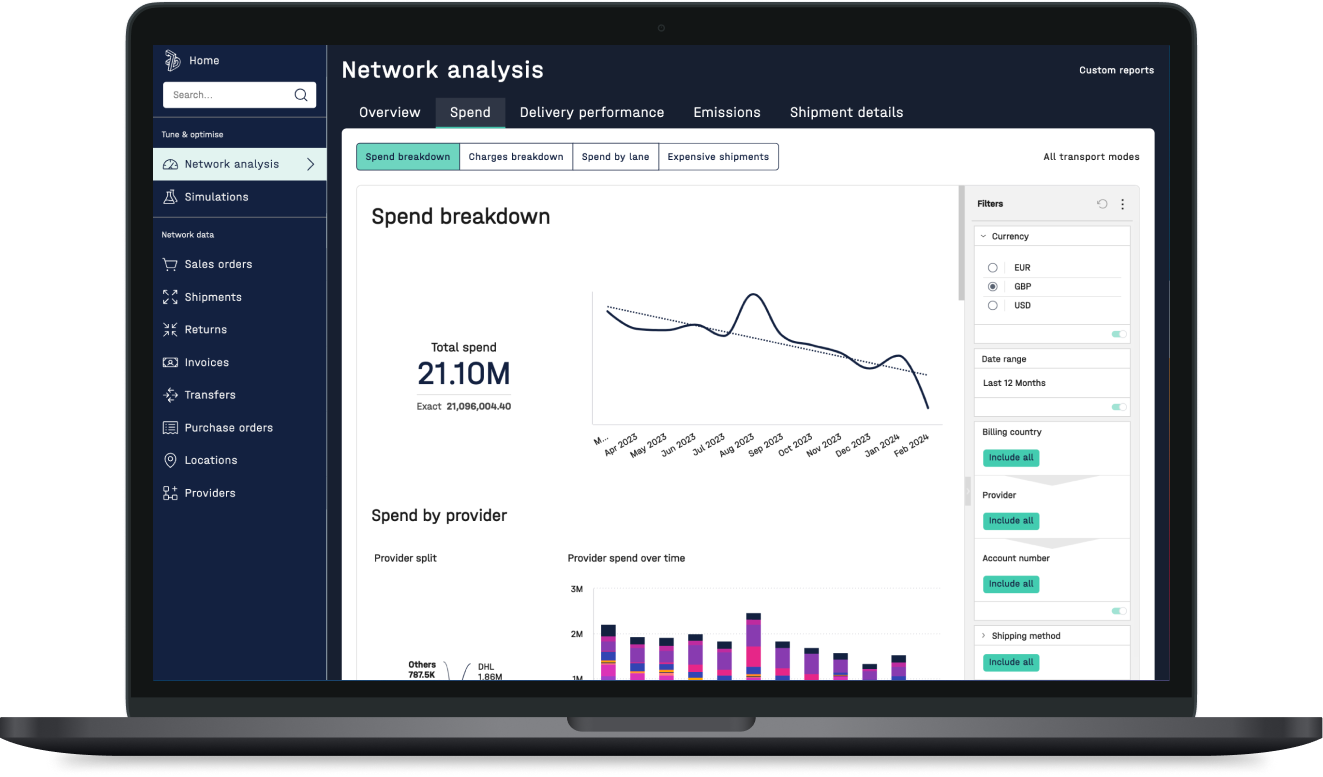
When this CDMO joined the 7bridges platform, they had a lot of questions about data visibility with a specific interest in what lanes they had available to them. After taking their data into the platform, we discovered that 39.7% of their lanes weren’t on rate cards. That accounts for 12.5% of their total spend. 

Having visibility of this data means that, with 7bridges, they were able to identify an area of their supply chain that needed attention in a way that they could not have previously. Since learning that, the CDMO has started reaching out to their providers to procure new rate cards for these lanes that better reflects their existing usage.

Laptop _ Network Analysis _ Spend Breakdown

How can I use benchmarking data to optimise my supply chain network?

Challenges with getting data right

Getting clean and usable data to put into calculations can be difficult for a lot of reasons. And many of them are difficult to eliminate on your own, whether it’s because of what you’re getting from third parties or the simple fact of human error.

database icon coral

You don’t always get good data from 3rd parties

Sometimes suppliers don’t provide you with the data you need. Hard stop.

Often, it’s not even that they are being deliberately opaque. It’s much more likely that they don’t know what you need and provide only the same types of data to all of their customers.

This can make it difficult for you to know what you could have better access to. (This is one area where a platform like 7bridges can help - we can sometimes go to them directly to get the data that’s needed.)

Alert Coral Icon

Human error happens

As much as any of us wish otherwise, human errors do happen. Whether it’s a misplaced decimal or an incorrect address number, these small mishaps can add up over time. Because of that, relying solely on human input for your supply chain data can mean you have a growing amount of inaccurate data sitting on your servers. This is especially problematic if you’re also missing the next part…

graphic coral icon

You don’t have a way to standardise data

Standardised data is a crucial part of making your data work for you. If it isn’t standardised, you end up with fifty different formats that almost (but don’t quite) align. Which is how your data ends up messy and unusable. Paired with the human errors from above, it’s no wonder it feels like garbage.

How to stop getting ‘Garbage Out’

The main goal of addressing your data challenges is to get results that lead to valuable and usable insights. Meaning there’s no room for garbage outputs. But ending the ‘Garbage Out’ part of GIGO is easier said than done. 

Stop putting garbage in

One way that you can start getting better results from your data is to start putting in guidelines and processes for making the data you enter more standardised and valuable. To get you moving, we’re sharing our quickstart guidelines for better data. It comes complete with a handy checklist you can use to mark your progress along this journey toward cleaner data:

Want to get your data sorted and usable?    Check out this easy-to-use data management checklist

Two key categories

As you start your data management project, there are two broad categories that you’ll need to look at to make it effective. Those categories are data formatting and data processes.

When paired together, these two categories create a set of procedures that will keep your data clean, easy to use and focused on your objectives.

To make this really easy, you can pull in technology like 7bridges to help keep your data cleansed and standardised. We can do a lot of the heavy lifting in the background without you having to worry.

When your invoices and rate cards go into our platform, we get to work right away to make sure your data is usable. You’ve probably noticed that the data you get given by default comes in a lot of different formats with different service names for similar results. (And that’s without taking into account any accidental misspellings.) 

So once it’s in the 7bridges platform, your data gets processed through our databases. During this we categorise it by service type, vehicle type and more so that you have clear, standardised data that is actually comparable. Without taking this step, your data won’t be able to provide you useful insights and will, instead, slow you down.

Data processes have to do with the way you receive, store, state and review data.

Data formatting, meanwhile, has more to do with how you display and share data– the important part here is to keep it clear and consistent. We also include which pieces of information are useful to include in this part of the checklist.

We also know that this can be a big project, which is why we don’t demand that all of your data management work is done before we start working together. In fact, even with our simplest automation projects, we take a lot of this on for you. Data should never be a barrier to your supply chain’s success– only an asset. 

Get help taking the garbage out

This is a part of the process that 7bridges can really help with. We want you to make the most out of your data and can make sure you’re only putting the good stuff into our platform. 

Not only does working with us mean you have a team of data specialists working on your supply chain, but it also means having access to all of the tools we have built to ensure your data is in the best state possible. And we’re always innovating to create better and better solutions.

By employing the 7bridges platform, you’ll start seeing:

  • Clean, standardised data that’s easy for you to use
  • Data pulled directly from your suppliers, already in a usable format (eliminating possible points of human error)
  • More clarity on what data is actually useful

Staying garbage free

As long as we are using data, there will be those who repeat the old mantra of Garbage-In-Garbage-Out. But you don’t have to be one of them. Instead, you can have high-quality data that gets fed into advanced platforms and algorithms and get out meaningful insights.

Ready to see what a supply chain without garbage data looks like? Book a demo with us and get better data.

benefit1

Discover our platform

Find out how the 7bridges' platform can help optimise your supply chain. 

benefit2