With climate impacts like wildfires on the rampage and more and more stringent regulations coming into place, carbon emissions are on everyone’s mind. For supply chains, that means reporting and optimisation are quickly becoming must-haves for the industry.
Even for businesses that don’t have formal net-zero commitments, you may find that you’re subject to reporting standards like the Corporate Sustainability Reporting Directive (CSRD) that officially kicks off in January 2024. If that’s the case, you’ll need to be able to shed light on important carbon figures like your scope 3 emissions, the vast majority of which come from the supply chain.
Read more: What does CSRD mean for supply chain managers?
Unfortunately, not all emissions reporting platforms are created equal. In a lot of the conversations we have with supply chain leaders, we’re told that getting detailed enough reports to be useful is often very difficult. And for companies that supply other businesses, they’re getting pressure on all sides to provide that data accurately.
Luckily, there is another way. Here at 7bridges, we believe that smarter supply chains (led by data) benefit everyone. In this case, that means supply chain leaders like you and the planet. To really make a difference, we built our emissions layer to accurately calculate your carbon output and find solutions for reducing it without sacrificing your other goals.
Supply chain emissions reporting
The emissions layer is a source of detailed, granular emissions insights that goes beyond basic reporting. Not only will you be able to provide answers to the usual questions about carbon, but you’ll also have the ability to dig deeper. This deeper understanding of your data is what you need to turn it into something useful and actionable.
Most carbon reporting tools are just that, reporting tools. They can give you single snapshots of your emissions data and rarely offer any way to explore what that means for your supply chain. We think of the emissions layer as an additional lens to look at your overall supply chain through. And you’d want that granular visibility for other supply chain data. Why wouldn’t you want the same for emissions?
Detailed supply chain emissions data
Everyone has a different idea about what detail and granularity mean for their supply chain, so we like to be open about what it means to us. In the 7bridges platform, we make sure you can see exactly which ways you can examine your data. Below, you can see a few of the different views our emissions layer provides:
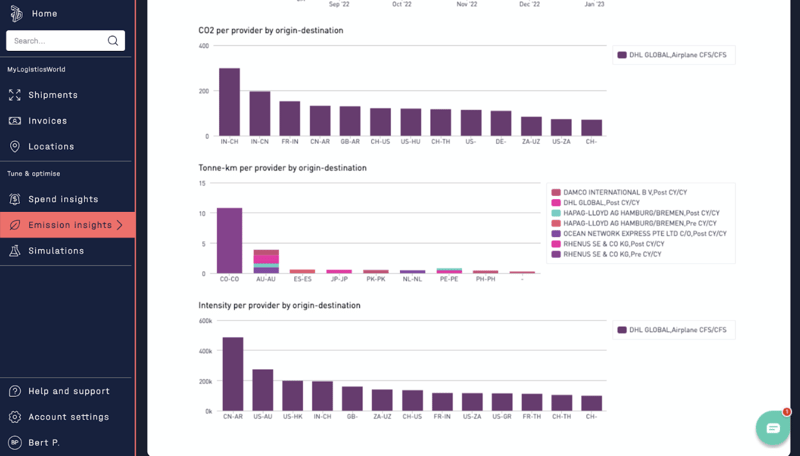
As you can see, you will easily be able to view your carbon emissions per provider (by where you ship from and to). You’ll also see your emissions for each origin to destination in tonnes per kilometre. That will help you see which delivery areas are creating the most carbon. When you know that, you may be able to identify ways to change that.
Read more: Bad supply chain data isn’t the problem— here’s why
Another important view is your intensity per provider. That means you can see which of your providers is the most (and least) carbon efficient. And beyond the views you can see in the screenshot above, you can also see detailed carbon data by lane and align your providers to the vehicle types they use.
These kinds of breakdowns, and others not touched on in this blog, can really open your eyes to how much your supply chain is emitting.
Optimising supply chain emissions - getting to net-zero
So, in addition to that granular, detailed view of your emissions data, our platform can also give you insights into how best to start reducing emissions. Using your actual supply chain data, you can run simulations to find the most optimal path for your business. And you can adjust them depending on your overall goals.
That means you won’t just see one way to start cutting down your emissions, but several variations. You can see what it would be like to optimise purely for carbon, purely for cost or trying to find a happy medium between the two. Depending on the constraints that you set in place with our team, you can find the exact balance that suits your company’s strategic needs.
Learn more: The green ratio- balancing for cost and carbon
Getting real detail in your supply chain emissions data doesn’t have to be a struggle. With the right tools in place, you can see more and emit less while protecting revenue or without having to give up performance. No matter your strategic goals, true supply chain emission visibility is achievable.
Ready to find out how 7bridges can do this for you and your supply chain? Get a demo and talk to one of our experts today.